data-visualization

Adjudication

Tools used: d3, <canvas>, hard gay

June 26ths:

Lawrence v. Texas (2003): same-sex intercourse becomes legal across the United States

United States v. Windsor (2013): the federal government begins fully recognizing same-sex marriages

Obergefell v. Hodges (2015): same-sex marriage becomes legal everywhere in the United States

In colour: Audio rainbowscapes

Thing practiced: drawing rainbows

Tools used: the JS Web Audio API, three.js instead of actual WebGL, Safari mobile web inspector

Jamie xx’s new album In Colour is finally out, and it’s good.

Do you ever get that feeling, when you’re up at 2 am and almost alone, of being enveloped in something with maybe someone, of melancholy becoming euphoric? This album feels like that. It’s dense and fleshed out, not downbeat and cryptic like the xx past — but still lonely, and lovely. Listen with good headphones.

And

Because I loved this album and its cover so much, I built an album-themed beat-detecting visualizer here:


(If the presets are unsatisfactory, drag and drop your own audio file onto the page.)

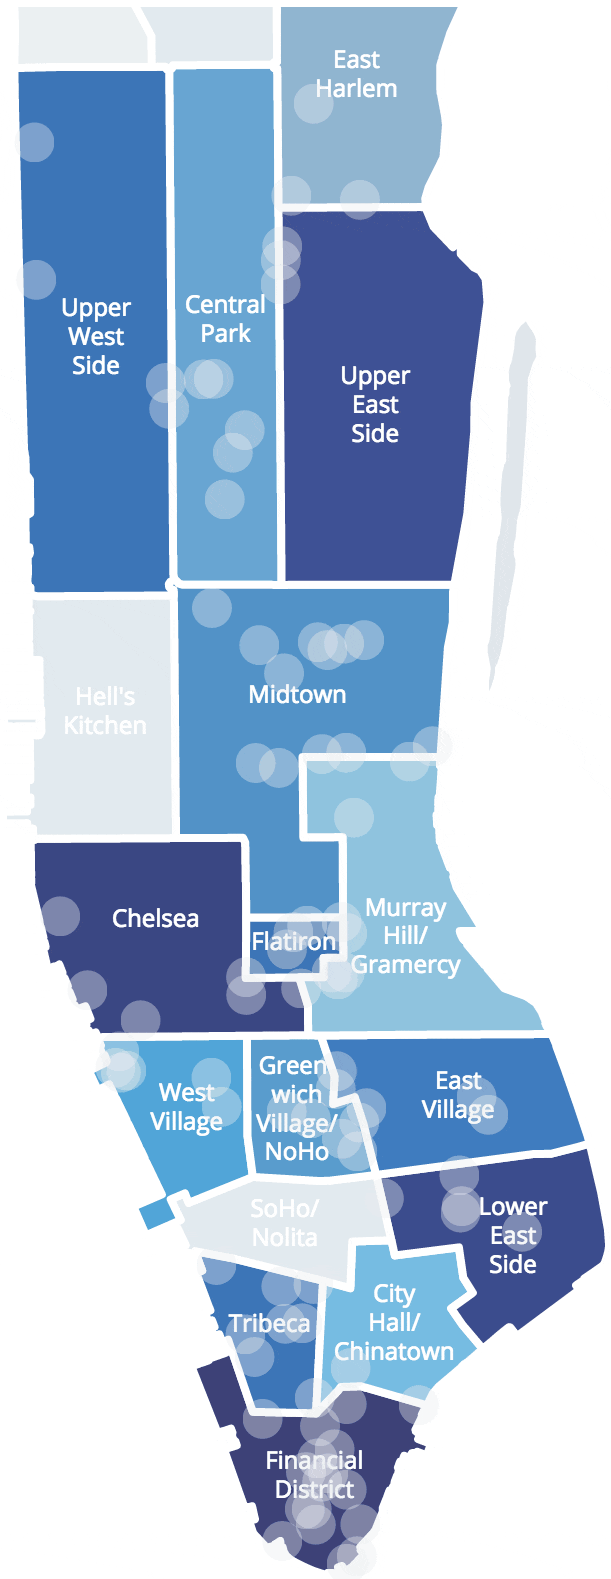
Remarkitecture NYC: Lower Manhattan

Tools used: camera, D3.js, being a touristy dork

Thing practiced: documenting neat buildings so I don’t forget

I’ve always loved beautiful buildings, and New York as their apotheotic urban motherland. Cities (and humans) have to perpetually reinvent themselves to stay alive, and New York is the best example of this I know. There’s vast beauty in the uniformly-timeworn structures of Renaissance Florence or the Campidoglio, true — but a modern city needs more.

Architecture, as Vincent Scully says, is a conversation between generations. What New York’s architecture shows us is that we can both safeguard the past and believe that today can be just-as-good or better.

See the clicky-map version (
)
, or just the notes; all photos from May 9–13, 2015.

Drought!

Tool used: D3.js; data from the Drought Monitor

Growing up in coastal California it’s easy to forget the truth: it’s weird that we can live here at all. We owe our survival to massive hydraulic works—aqueducts and siphons and weirs bringing us water from Hetch Hetchy or the Oroville or the Colorado River.

After three years of debilitating drought, these aren’t enough. The reservoirs are dwindling, crops are being left to die, the NYT is calling us apathetic, and towns are running out of drinking water.

Drought severity in California, 2010–today

Institutional politics

Thing practiced: data visualization, sort of

Tools used: D3.js, GDAL


Gay marriage around the world
Mar 2013
(drag to rotate)
(Bigger version here.)

The Supreme Court is considering two big same-sex marriage cases next week—Tuesday’s case (3/26) decides the constitutionality of Proposition 8, which bans gay marriage in California, and Wednesday’s case (3/27) covers the federal Defense of Marriage Act, which defines marriage in the U.S. as exclusively between a man and a women. ☠️

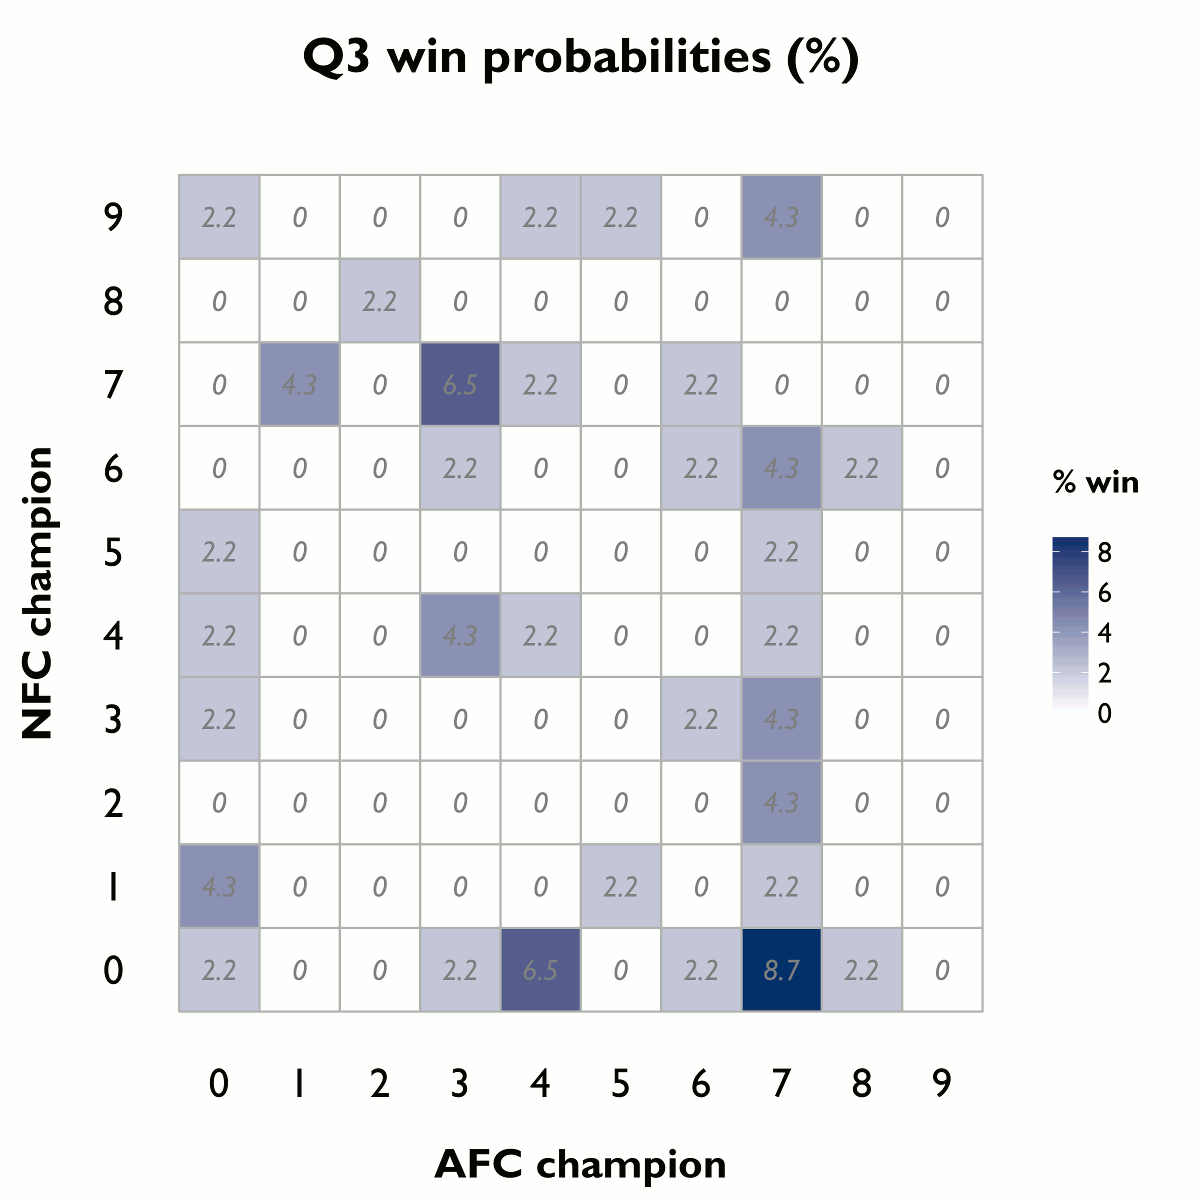
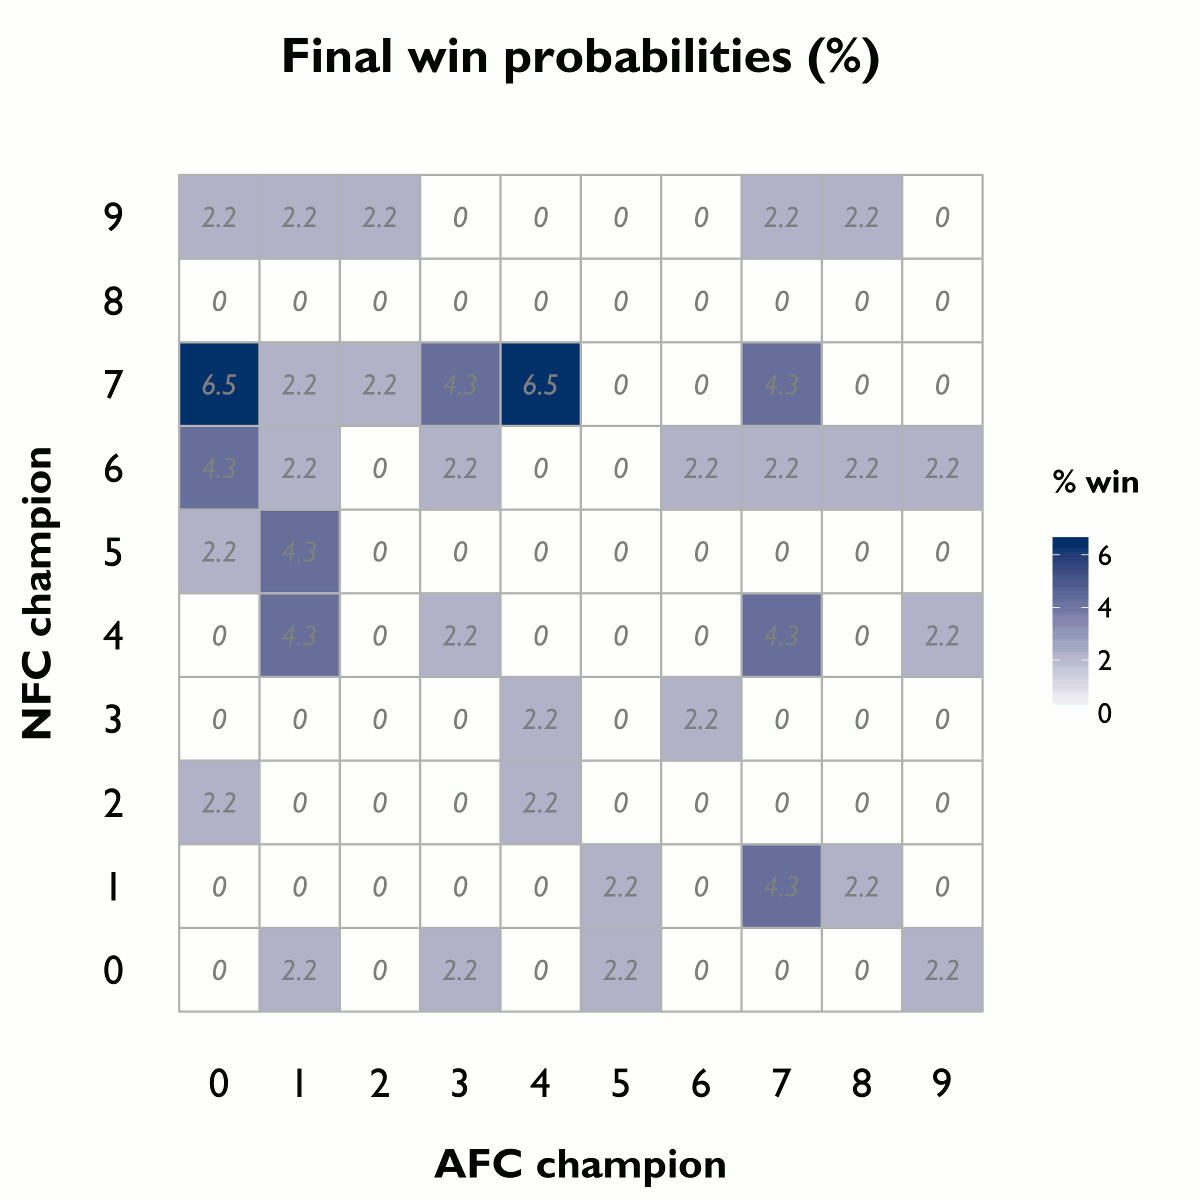
Data: Super Bowl pool squares

Tools used: RStudio with ggplot2, plyr, reshape2, and XML packages

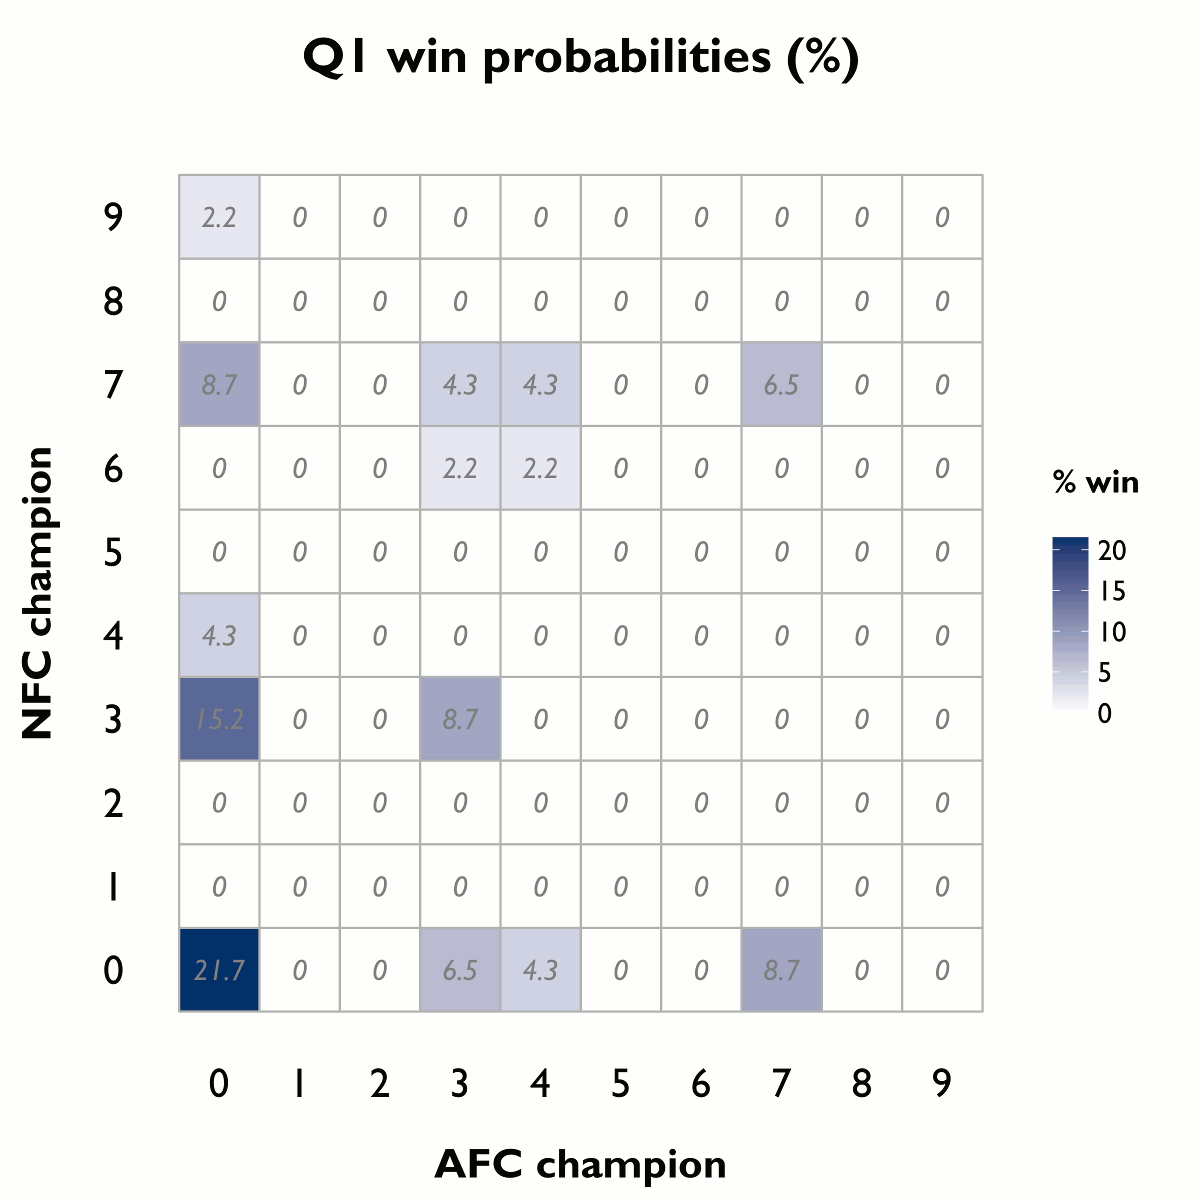
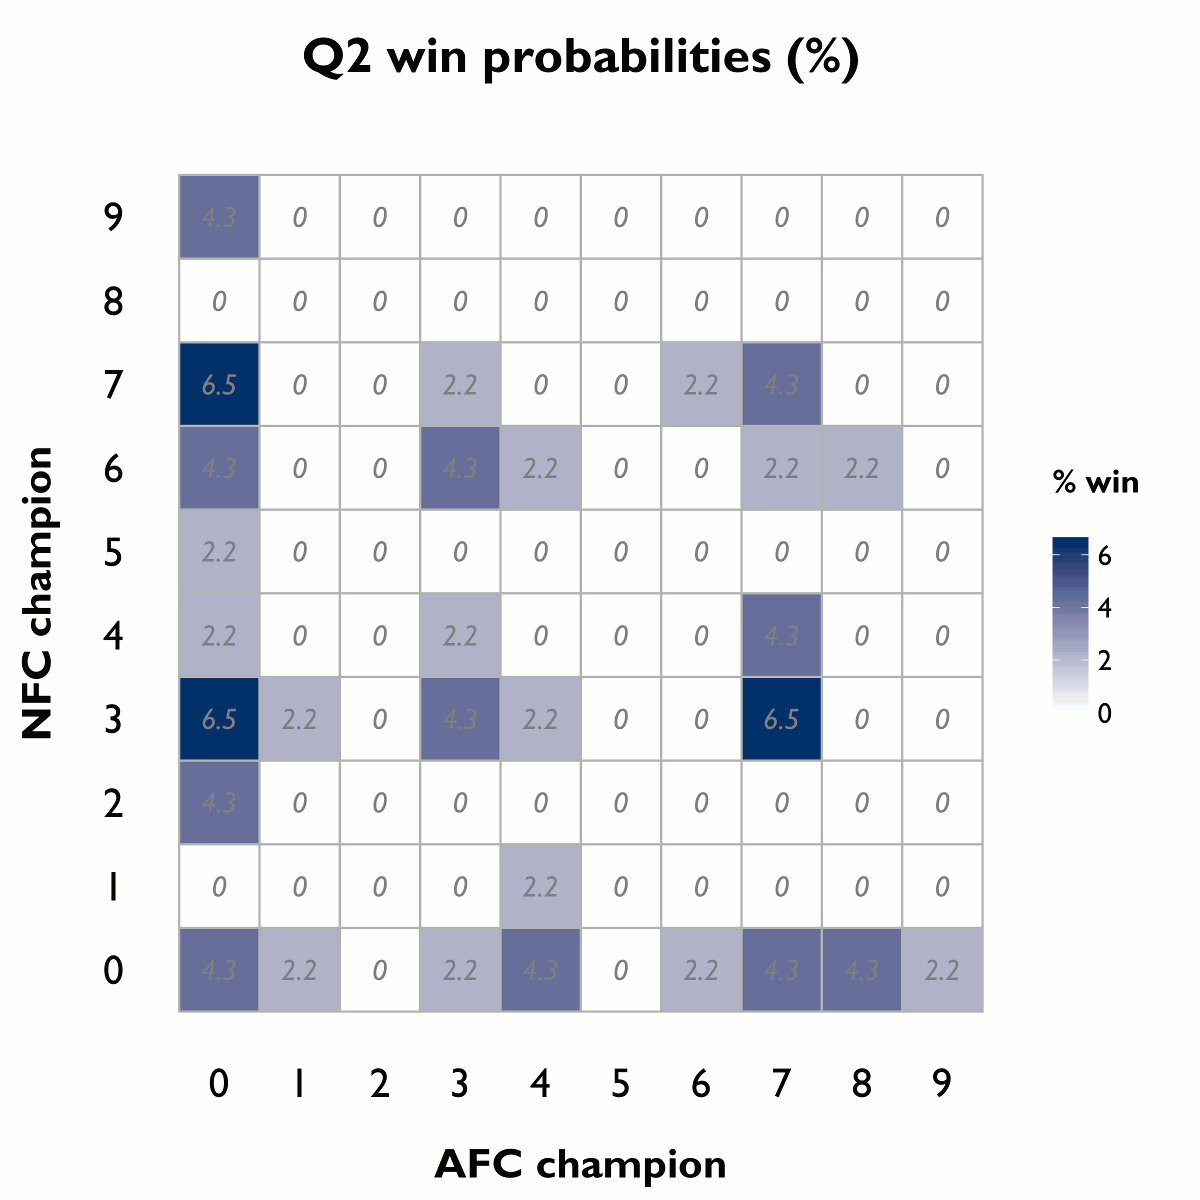
The way Super Bowl pools work, I’m told: people who buy in are randomly assigned a pair of numbers on a 10-by-10 grid. At the end of each quarter, the person with the box corresponding to the last digits of the two teams’ scores wins part of the pool.

Since some of us’ll be participating in a pool like this on Sunday, it might be useful to look at which numbers are most likely to be profitable.

Q1 Q2

.

Q3 Final

(R code here).

Data graphic: Unemployment in the US

Thing practiced: data visualization

Tools used: RStudio, ggplot2, and Inkscape

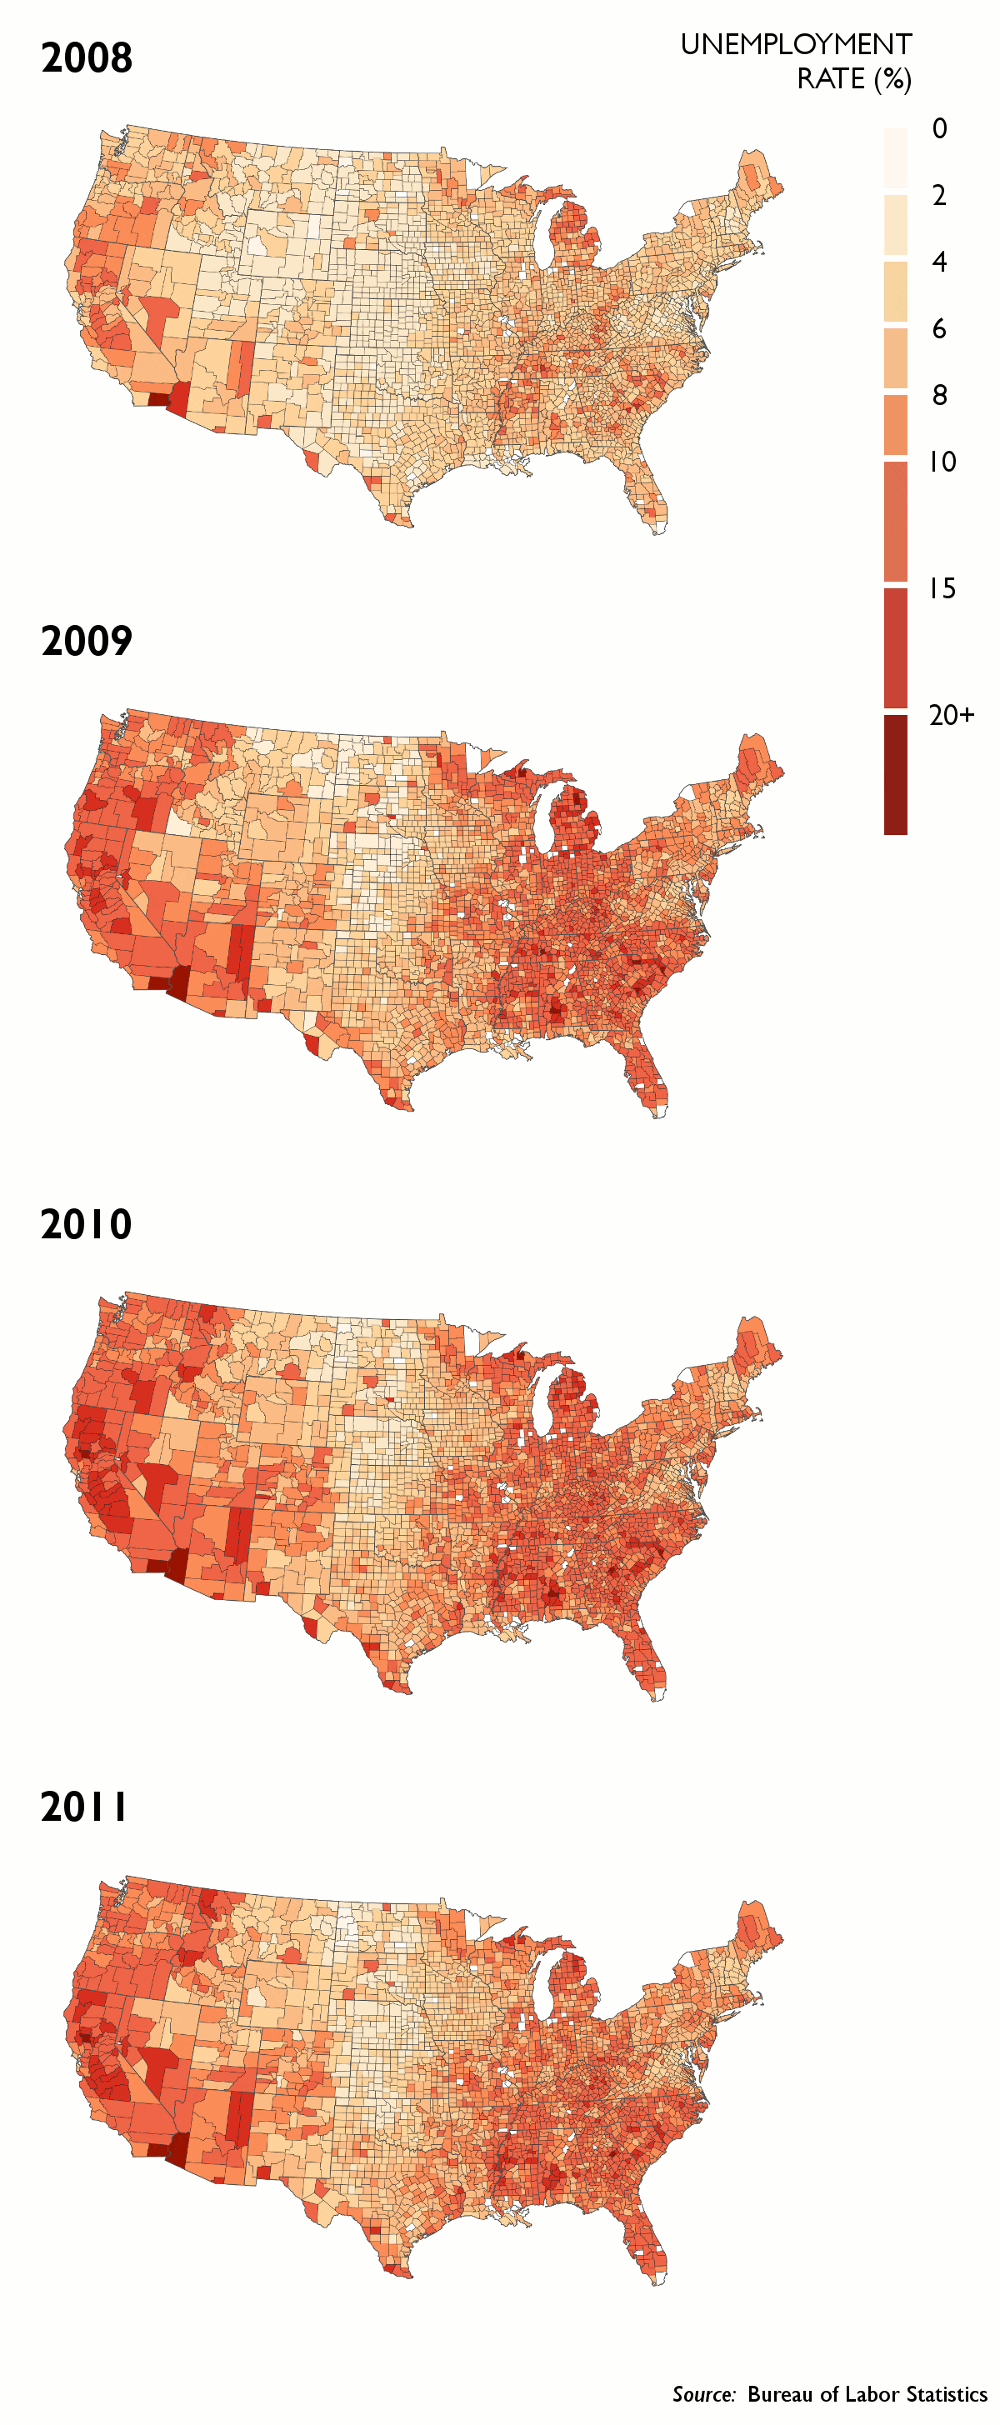
For today’s practice I tried to recreate the graphics in Nathan Yau’s unemployment map from 2009 using R and ggplot2.

Code for the solution is here.

The Bureau of Labor Statistics makes state-, region-, county-, and city-level unemployment data available in flat files via FTP here. I used mapping data from the R maps library to draw the regions, but the county names there don’t match the BLS county names exactly – I removed references to “County”, “Parish”, and “City” in the county names to solve some of the mismatch problems, but a few counties are still missing. Also, I didn’t bother plotting and insetting Alaska or Hawaii.

The result (this would’ve been more interesting if I’d waited until the 2012 data was released, but still): unemployment choropleth