Tools used: RStudio with ggplot2, plyr, reshape2, and XML packages
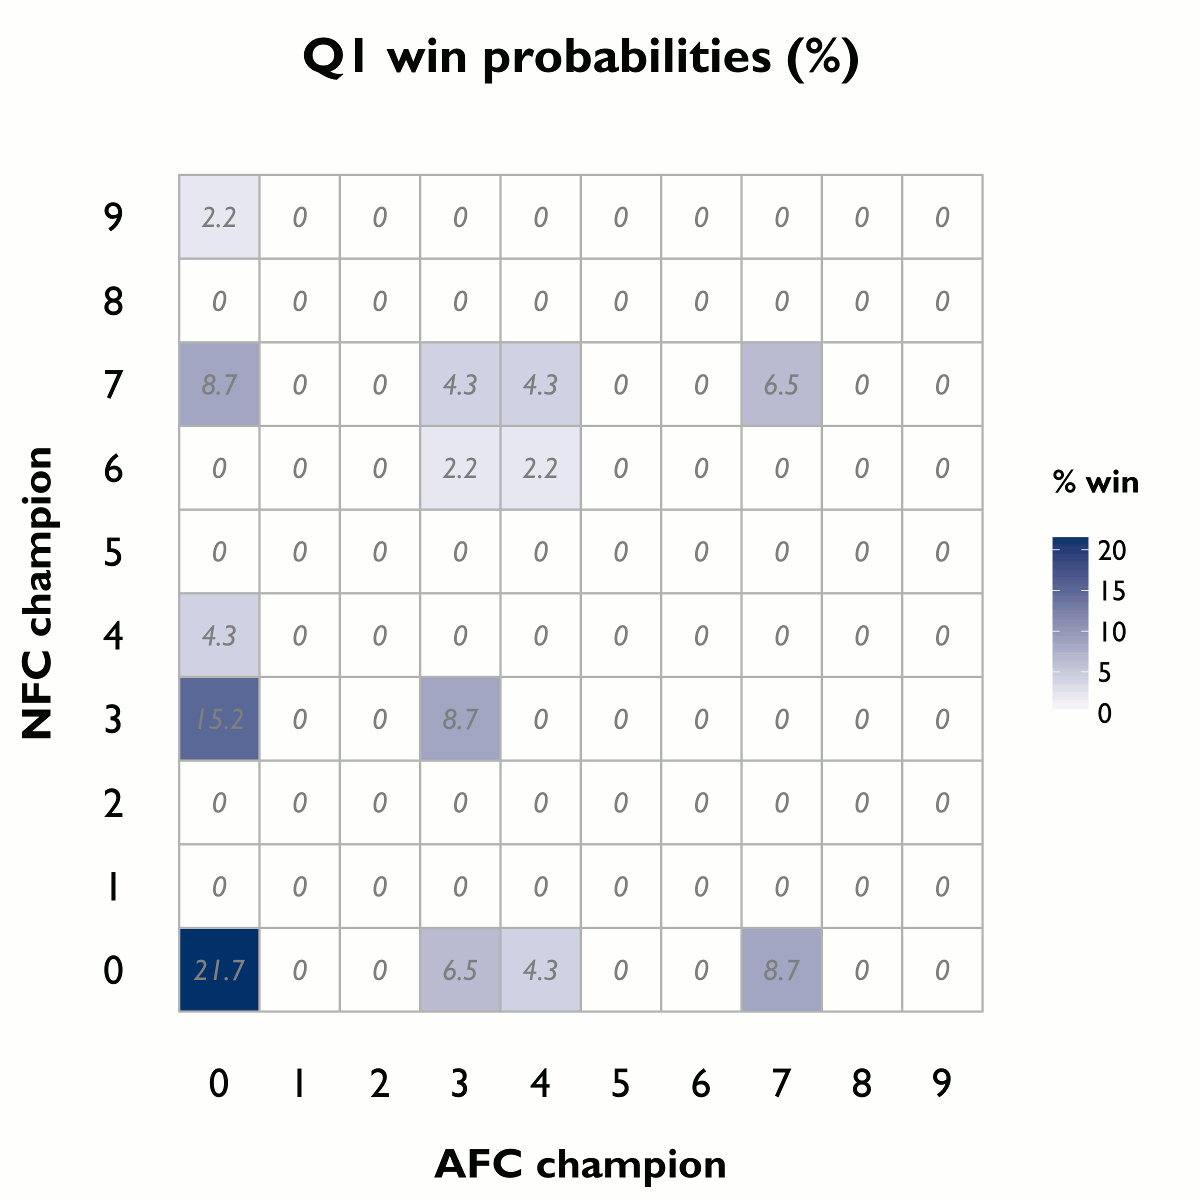
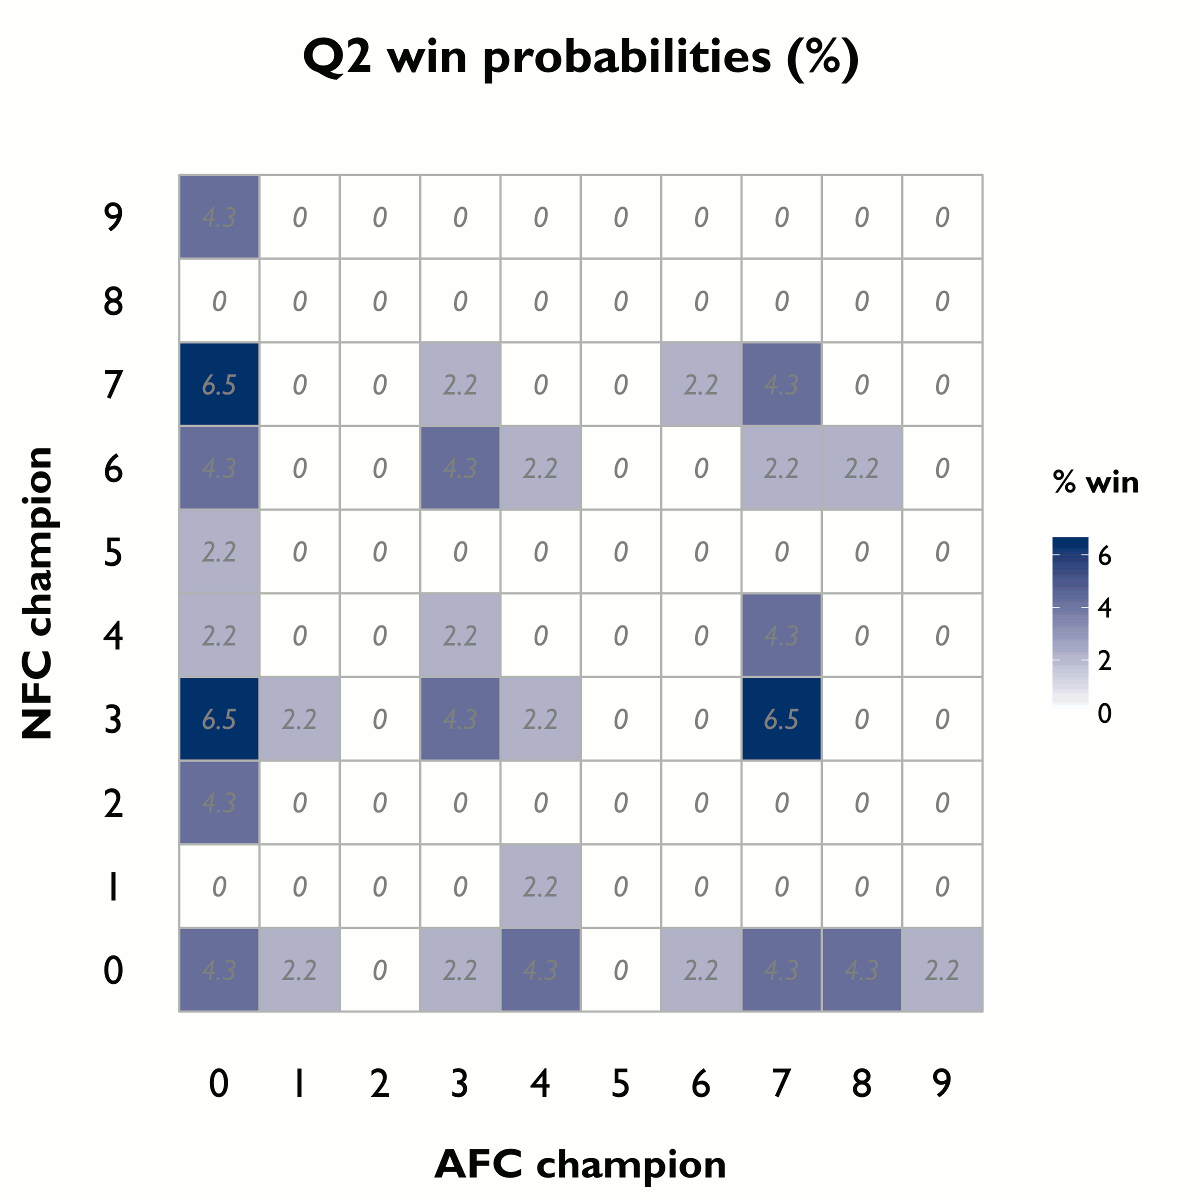
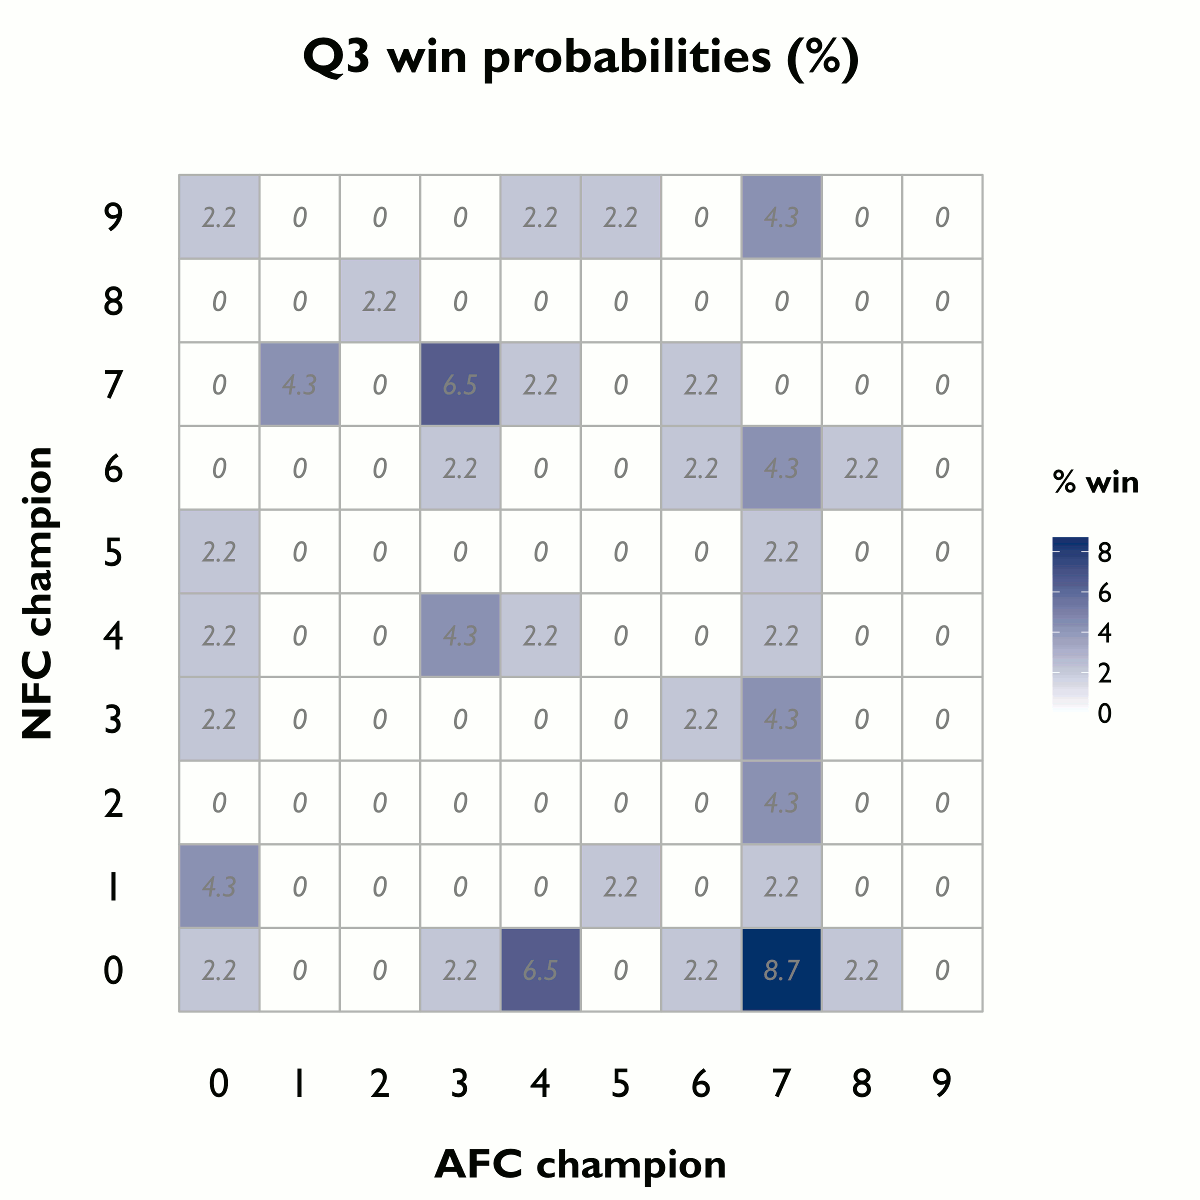
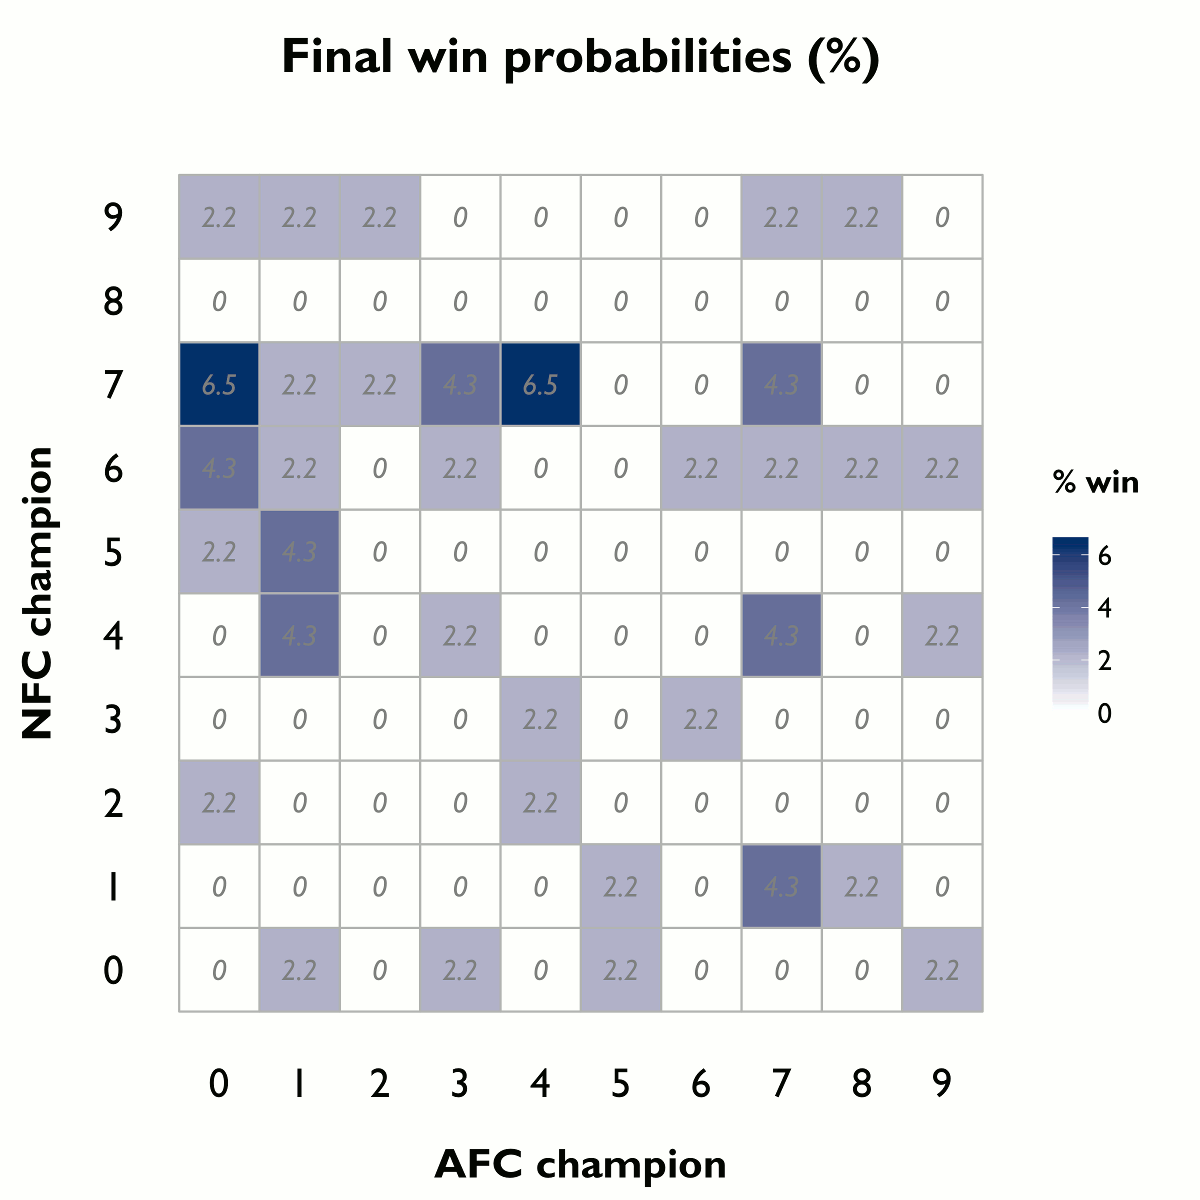
The way Super Bowl pools work, I’m told: people who buy in are randomly assigned a pair of numbers on a 10-by-10 grid. At the end of each quarter, the person with the box corresponding to the last digits of the two teams’ scores wins part of the pool.
Since some of us’ll be participating in a pool like this on Sunday, it might be useful to look at which numbers are most likely to be profitable.
.
(R code here).


